
How to Use the CDC Data Project Dashboard
The CDC Data Project works to spread awareness about the Trump Administration's proposed cuts to CDC in FY26. The dashboard compares the proposed budget against CDC funding for Fiscal Years 2023 and 2024 using publicly available data.
Compared to 2023 levels, CDC is expected to lose $5 billion, which is over half of its current budget. In 2023, over 80% of that funding went directly to states, tribes, and communities through grants and cooperative agreements. Due to the drastic cuts proposed in the budget, plus ongoing staffing cuts, it is unclear what will happen to these grants and cooperative agreement programs. States and local health departments, tribes, and community organizations could lose funding that they rely on to run programs that keep people safe and healthy.
Use this dashboard to learn what is at stake, which communities stand to lose the most, and which programs might disappear altogether. Understand how the proposed changes to HHS could directly impact your community. For more information about this dashboard and how it was built, visit the Methodology page. Email media@nationalphc.org with questions.
Step 1: Learn about the Proposed Changes
Start with the first two tabs to get an overview of the proposed changes to CDC’s budget and the proposed reorganization of CDC. These tabs will give you an idea of how CDC has been funded for the past two years, how much money could be cut, and which programs will be eliminated. It also gives an overview of Secretary Kennedy’s proposed Agency for Healthy America (AHA).
You can also view a list of CDC programs that would be eliminated as part of the FY26 Budget and their current funding level. It’s important to note that many of these programs have already been effectively eliminated as part of the Reduction in Force (RIF) that occurred on April 1, 2025.
Step 2: Dive Deeper into Proposed CDC Funding Cuts
On the third tab, explore the proposed changes to CDC’s budget in depth. You can view and compare the proposed changes at the Center/Office, Program, and Funding-Status levels. You can also filter to see which programs the budget and reorganization may be maintaining, moving, and eliminating.
Select multiple filters to compare across programs and sub-programs. You can also develop detailed tables comparing the program’s budget from FY24 with the proposed FY26 budget.

Step 3: View Proposed Cuts at the State Level
On the fourth tab, you can dive into how the proposed cuts may impact grants and cooperative agreements in your state. You can view which programs may see the most drastic cuts in your state. You can even filter by recipient type to see how proposed cuts could impact your state health department, hospitals, small businesses, community organizations, and more.

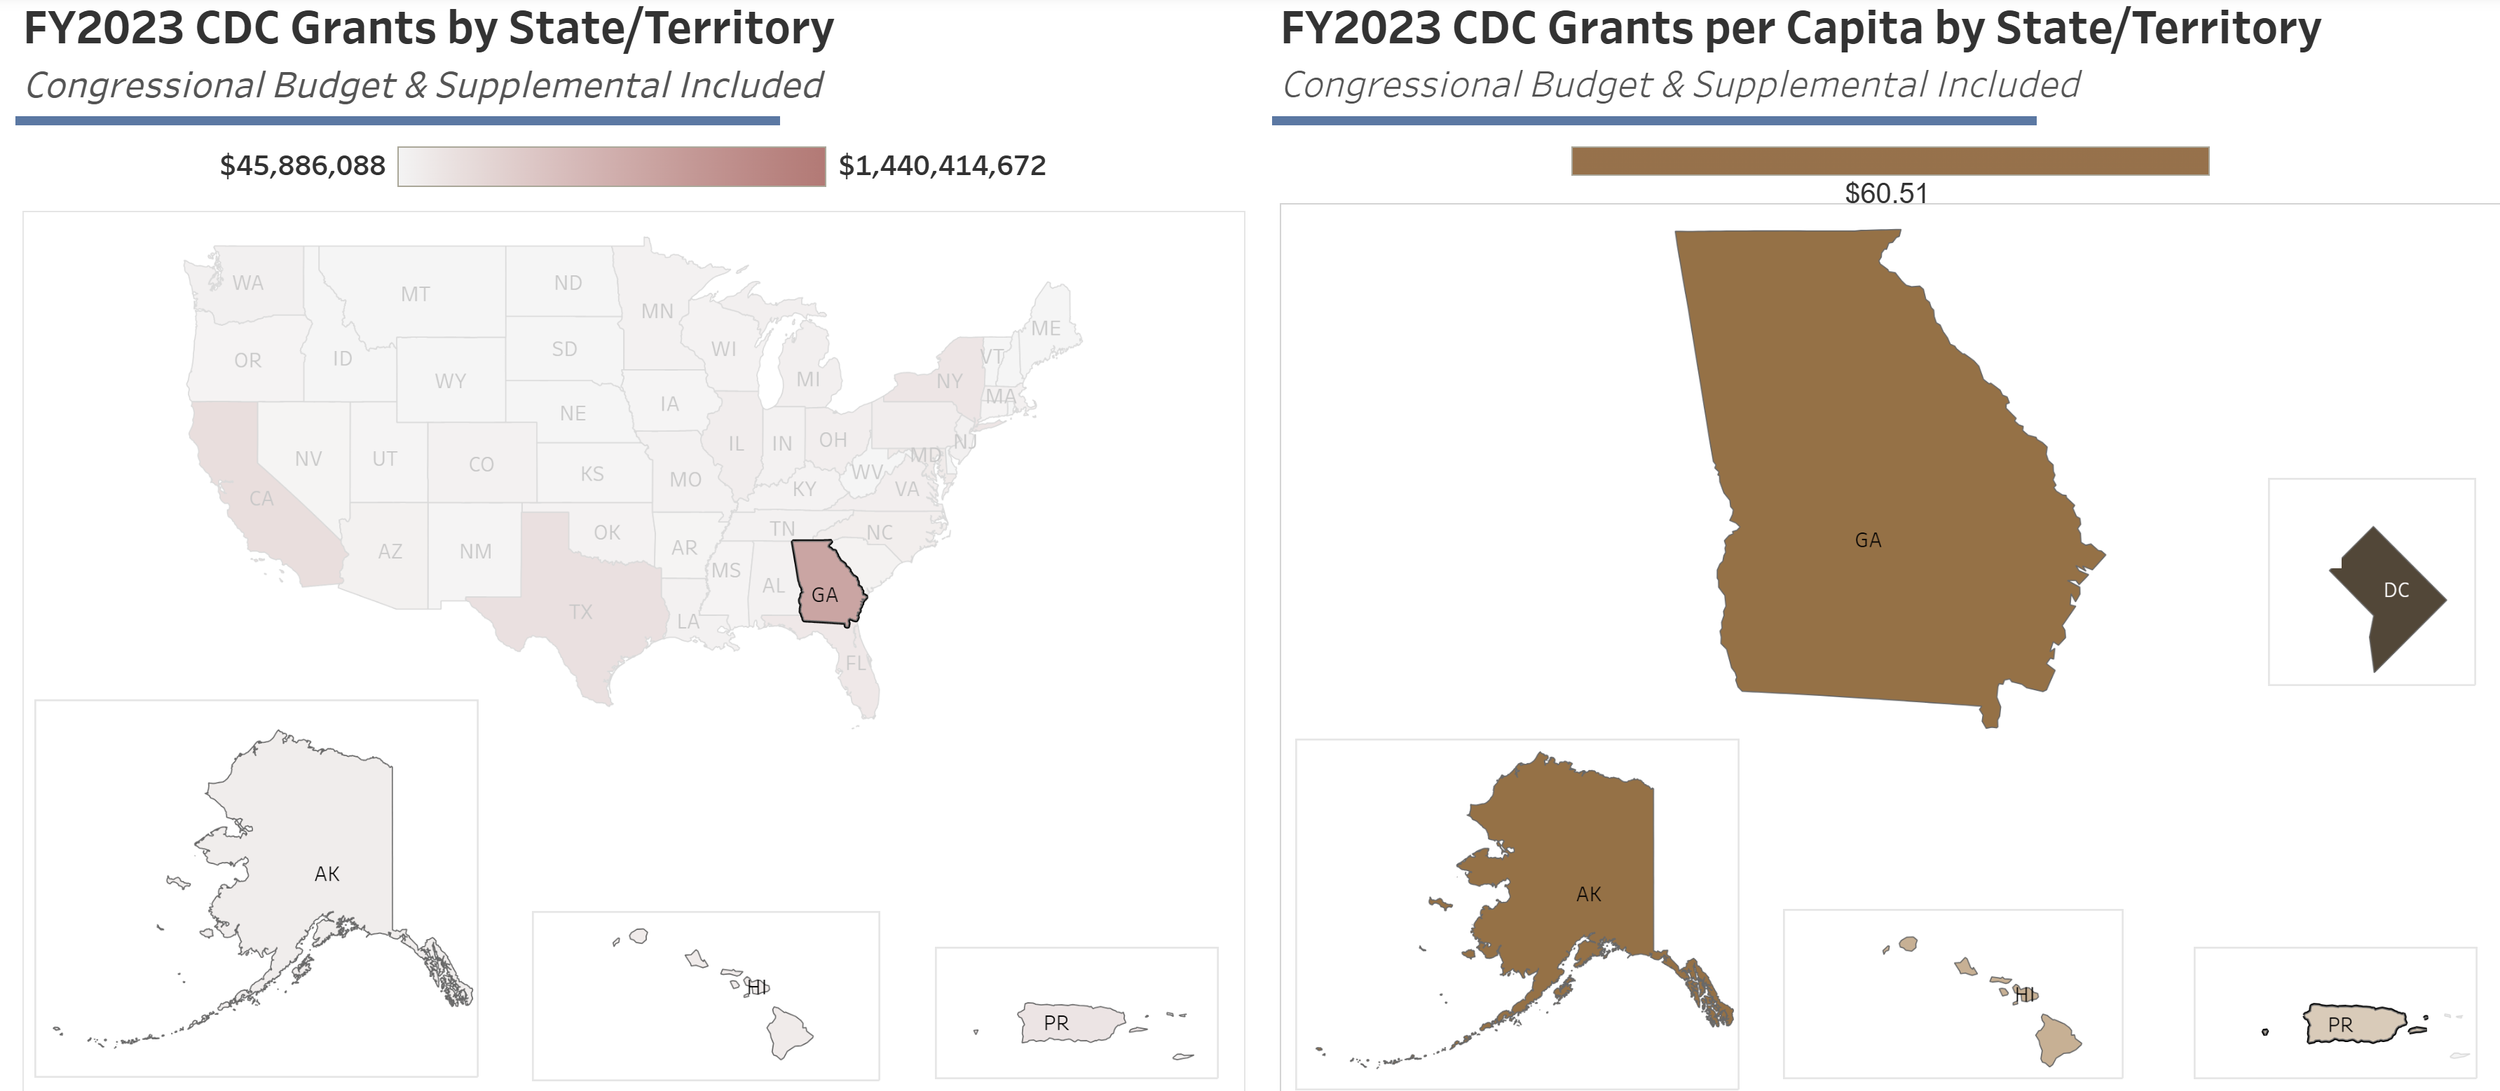
Further down, you can view CDC Grants by State/Territory overall and based on population. Hovering over or clicking on a state or territory will open up details about FY23 funding for that state as well as potential funding loss under the proposed FY26 budget.
You can also see a detailed view of which cooperative agreements support research, health programs, and more in your state. The detailed table view allows you to see how public health funding in your state could be impacted based on the FY26 budget.

If you have questions, please email cdcdataproject@proton.me.